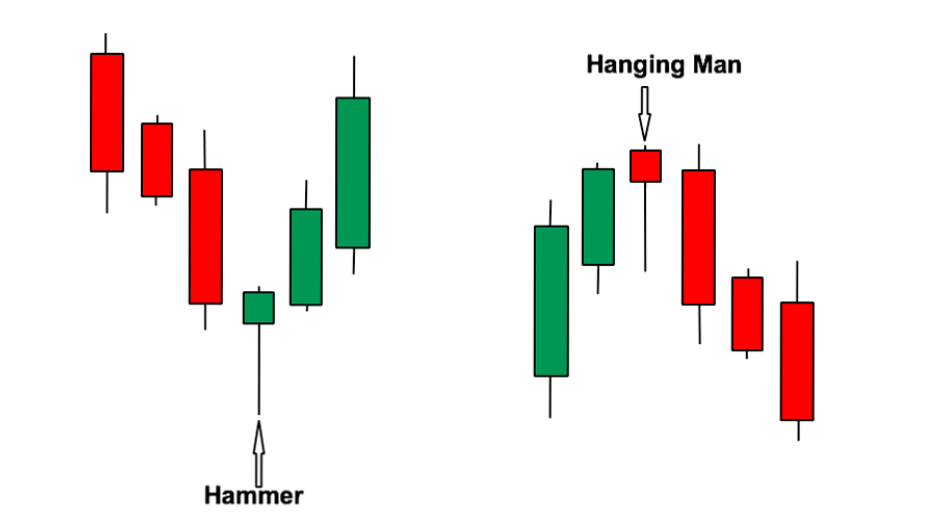
The Hanging Man Candlestick is a bearish reversal pattern that typically appears after an uptrend. This single candlestick pattern suggests that selling pressure is increasing, which may lead to a trend reversal.
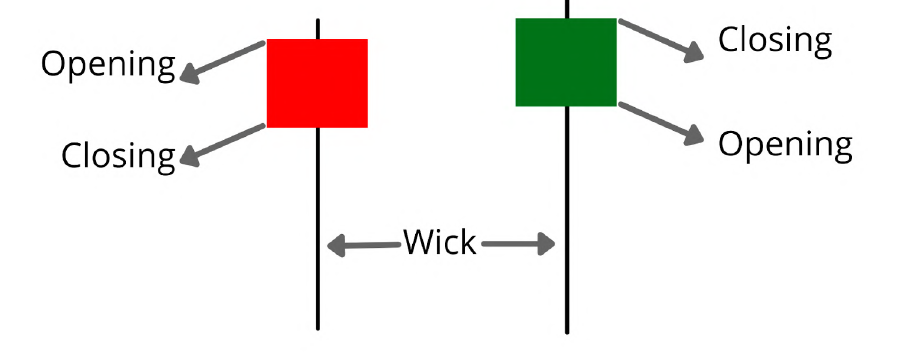
The candlestick has a small body near the upper end of the trading range and a long lower wick. The long lower wick indicates that sellers pushed the price significantly lower during the session, but buyers managed to push it back up near the opening level. However, the inability to maintain higher prices signals potential weakness in the uptrend.
Traders often use the Hanging Man pattern alongside other technical indicators to confirm bearish signals before making decisions.
Hanging Man Candlestick एक मंदी का रिवर्सल पैटर्न है, जो आमतौर पर अपट्रेंड के बाद दिखाई देता है। यह एकल कैंडलस्टिक पैटर्न दर्शाता है कि बिकवाली का दबाव बढ़ रहा है, जो ट्रेंड रिवर्सल की ओर इशारा कर सकता है।
इस कैंडलस्टिक का शरीर ट्रेडिंग रेंज के ऊपरी छोर के पास छोटा होता है और एक लंबी निचली छड़ी (विक) होती है। लंबी निचली विक दर्शाती है कि विक्रेताओं ने सत्र के दौरान कीमत को काफी नीचे धकेला, लेकिन खरीदारों ने इसे शुरुआती स्तर के पास वापस धकेल दिया। हालांकि, ऊंची कीमतों को बनाए रखने में असमर्थता अपट्रेंड में संभावित कमजोरी का संकेत देती है।
ट्रेडर अक्सर Hanging Man पैटर्न का उपयोग अन्य तकनीकी संकेतकों के साथ करते हैं, ताकि मंदी के संकेतों की पुष्टि कर सकें।