Understanding the Hammer Candle in Technical Analysis
In the world of technical analysis, candlestick patterns serve as a powerful tool for traders to predict potential market movements. One such significant pattern is the Hammer Candle. Recognizing and interpreting this pattern can give traders valuable insights into market sentiment and potential reversals.
What is a Hammer Candle?
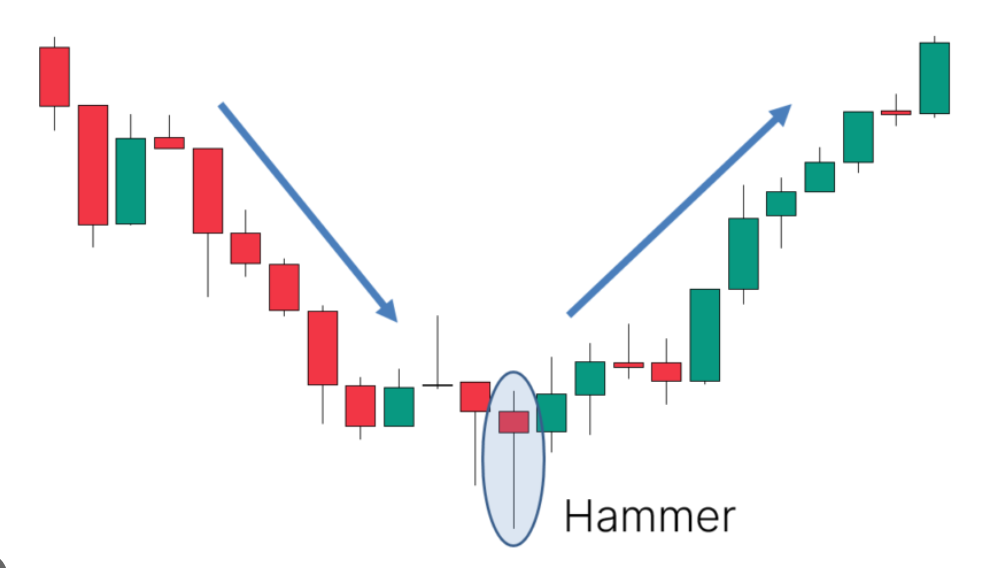
A Hammer Candle is a single candlestick pattern that appears at the bottom of a downtrend, signaling a potential reversal to the upside. Its distinct shape resembles a hammer, hence the name. The characteristics of a Hammer Candle include:
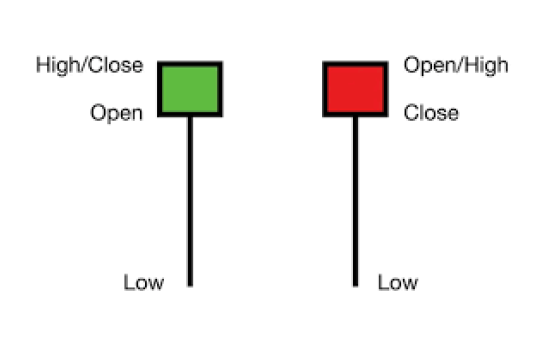
- Small Body: Indicates a narrow range between the opening and closing prices.
- Long Lower Shadow: Suggests that sellers initially drove prices lower, but buyers regained control to push prices back up.
- Little or No Upper Shadow: Reflects minimal resistance from sellers during the session’s recovery.
The Hammer Candle signifies a shift in momentum, where buyers overpower the selling pressure, hinting at a potential trend reversal.
How to Identify a Hammer Candle
To accurately identify a Hammer Candle, look for the following:
- Location: It should appear after a sustained downtrend.
- Body-to-Shadow Ratio: The lower shadow should be at least twice the length of the body.
- Color: While the candle body can be green or red, a green body is considered slightly more bullish.
Psychology Behind the Hammer Candle
The Hammer Candle reflects a battle between buyers and sellers. During the session:
- Sellers dominate initially, pushing the price to new lows.
- Buyers step in, absorbing the selling pressure and driving the price higher.
- The close near the session’s high indicates buyer dominance.
This shift in sentiment often leads to a price reversal, as market participants perceive the selling pressure to be exhausted.
Hammer vs. Hanging Man
It is essential to differentiate between the Hammer Candle and the Hanging Man. Both patterns have a similar shape but appear in different contexts:
- Hammer: Found at the bottom of a downtrend, signaling a bullish reversal.
- Hanging Man: Appears at the top of an uptrend, indicating a bearish reversal.
Trading with the Hammer Candle
To trade effectively using the Hammer Candle, follow these steps:
- Confirm the Trend: Ensure the candle appears after a significant downtrend.
- Volume Analysis: A Hammer Candle accompanied by high trading volume adds validity to the pattern.
- Use Confirmation: Wait for the next candle to close higher than the Hammer’s high, confirming the bullish reversal.
- Set Entry and Exit Points:
- Entry: Above the Hammer’s high.
- Stop Loss: Below the Hammer’s low to manage risk.
- Target: Based on nearby resistance levels or a risk-reward ratio.
Limitations of the Hammer Candle
While the Hammer Candle is a reliable pattern, it is not infallible. Traders should be cautious of the following:
- False Signals: Without confirmation, a Hammer Candle might fail to predict a reversal.
- Context Matters: Analyze the broader market context and other indicators before acting.
- Risk Management: Always use stop-loss orders to minimize potential losses.
Conclusion
The Hammer Candle is a powerful tool for identifying potential market reversals in a downtrend. By understanding its characteristics, psychology, and trading strategies, traders can leverage this pattern to make informed decisions. However, combining the Hammer Candle with other technical indicators and risk management practices is essential for consistent success in trading.
Mastering the Hammer Candle can be a stepping stone toward refining your technical analysis skills and enhancing your trading strategies.
हैमर कैंडलस्टिक पैटर्न: बाजार के रुख को समझने का एक शक्तिशाली उपकरण :
हैमर कैंडलस्टिक एक जापानी कैंडलस्टिक पैटर्न है जिसे बाजार के रुख को समझने के लिए व्यापक रूप से उपयोग किया जाता है। यह एक बुलिश रिवर्सल पैटर्न है, जिसका मतलब है कि यह आमतौर पर एक डाउनट्रेंड के बाद दिखाई देता है और संभावित रूप से एक अपट्रेंड की शुरुआत का संकेत देता है।
एक हैमर कैंडलस्टिक में एक छोटा शरीर होता है और एक लंबी निचली छाया होती है। शरीर ऊपरी छाया के नीचे स्थित होता है। यह पैटर्न एक हथौड़े के आकार जैसा दिखता है, इसलिए इसे हैमर कैंडलस्टिक कहा जाता है। लंबी निचली छाया यह दर्शाती है कि विक्रेताओं ने कीमत को नीचे धकेलने की कोशिश की, लेकिन खरीदारों ने कीमत को ऊपर की ओर धकेल दिया।
विभिन्न प्रकार के हैमर:
- इनवर्टेड हैमर: यह हैमर का उल्टा रूप होता है और यह एक बियरिश रिवर्सल पैटर्न है।
- डोजी: यह एक विशेष प्रकार का हैमर है जिसमें शरीर बहुत छोटा होता है।
हैमर पैटर्न का महत्व: हैमर पैटर्न ट्रेडर्स को बाजार में प्रवेश करने और निकलने का सही समय निर्धारित करने में मदद करता है। यह एक संकेत है कि बाजार का रुख बदल सकता है और कीमतें ऊपर जाने लग सकती हैं।
अन्य संकेतकों के साथ प्रयोग: हैमर पैटर्न को अकेले नहीं बल्कि अन्य तकनीकी संकेतकों जैसे कि मूविंग एवरेज, आरएसआई आदि के साथ प्रयोग करके अधिक सटीक संकेत प्राप्त किए जा सकते हैं।
सीमाएं: हालांकि हैमर पैटर्न एक उपयोगी उपकरण है, लेकिन इस पर अंधा विश्वास नहीं करना चाहिए। यह हमेशा अन्य कारकों जैसे कि बड़ी अर्थव्यवस्था, कंपनी के प्रदर्शन आदि को भी ध्यान में रखना महत्वपूर्ण है।
निष्कर्ष: हैमर कैंडलस्टिक पैटर्न एक शक्तिशाली उपकरण है जो ट्रेडर्स को बाजार के रुख को समझने में मदद करता है। हालांकि, इसे अन्य तकनीकी संकेतकों के साथ प्रयोग करना चाहिए और हमेशा अन्य कारकों को भी ध्यान में रखना चाहिए।
अतिरिक्त सुझाव:
- आप इस लेख को और अधिक विस्तृत बनाने के लिए चित्रों या चार्ट का उपयोग कर सकते हैं।
- आप हैमर पैटर्न के बारे में अधिक जानकारी के लिए अन्य स्रोतों का उल्लेख कर सकते हैं।