Introduction:
Analyzing Foreign Institutional Investor (FII) and Domestic Institutional Investor (DII) activity is crucial for understanding market trends. Whether you’re a seasoned trader or just starting, knowing where the big players are moving their money can help you make better investment decisions.
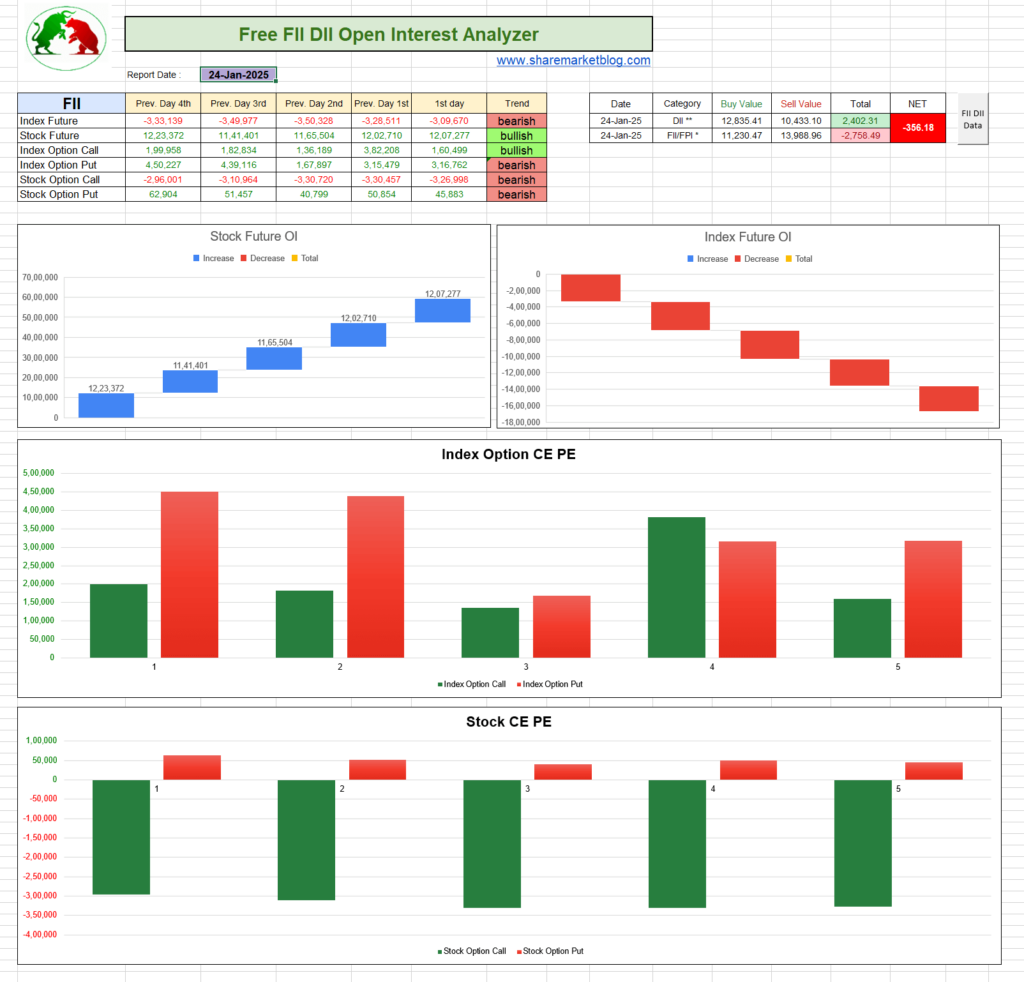
To simplify this for you, we’ve created the FII-DII Analyzer Excel Tool – a powerful and easy-to-use resource designed to provide insights at your fingertips.
Why FII and DII Data is Critical:
- FIIs and DIIs have a significant influence on the stock market.
- Tracking their buy/sell patterns can indicate market sentiment.
- Helps in identifying possible reversal points and trend continuations.
About the FII-DII Analyzer Tool:
Our Excel tool is designed to process raw FII and DII data into actionable insights. Here’s what it offers:
- Historical Analysis: View data trends over weeks, months, or years.
- Visualization: Interactive charts and graphs to understand buying and selling momentum.
- Decision Making: Spot patterns that align with market movements.
- Ease of Use: No coding or technical knowledge is required—just plug and play.
How to Use the Tool:
- Download the tool on our telegram channel @ https://t.me/intraday_trading_setup
- Just Run FiiDiiAnalyzer.exe
- View automatic charts, summaries, and insights.
- Make informed decisions based on the analysis.
Download the FII-DII Analyzer Tool:
Click the button below to download your free copy of the FII-DII Analyzer Excel Tool.
👉 @ https://t.me/intraday_trading_setup
Conclusion:
Stop relying on guesswork and start basing your trades on solid institutional data. With the FII-DII Analyzer Excel Tool, you’ll gain a significant edge in the stock market.