Bullish Harami Candlestick Pattern
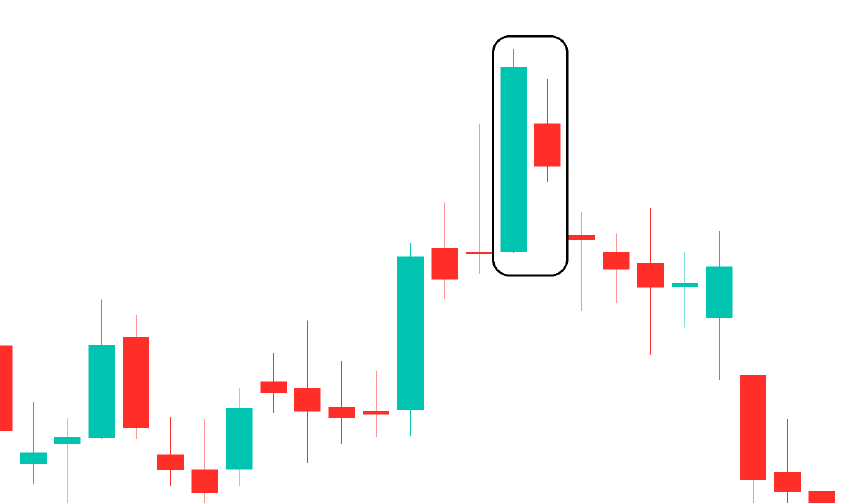
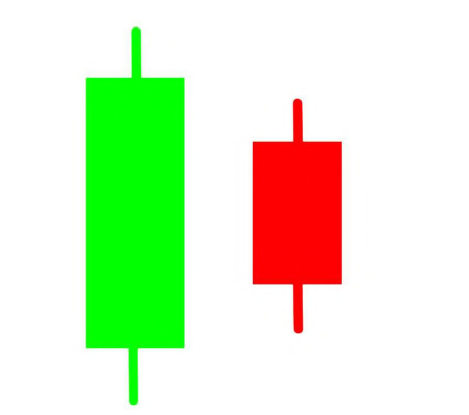
The Bullish Harami is a two-candlestick pattern that signals a potential reversal from a downtrend to an uptrend. It consists of a large bearish candle followed by a small bullish candle that is completely within the body of the previous candle. This pattern indicates a reduction in selling pressure and a possible shift towards buying momentum.
Key Features:
- Found at the bottom of a downtrend.
- The first candle is large and bearish.
- The second candle is small and bullish, staying within the previous candle’s range.
- Indicates possible trend reversal if confirmed by the next candle.
Trading Strategy:
- Wait for confirmation with a bullish candle after the pattern.
- Use volume analysis to strengthen the signal.
- Combine with other indicators like RSI or MACD for better accuracy.
बुलिश हरामी कैंडलस्टिक पैटर्न
बुलिश हरामी एक दो-कैंडलस्टिक पैटर्न है, जो यह संकेत देता है कि बाज़ार में गिरावट खत्म हो सकती है और अपट्रेंड शुरू हो सकता है। इसमें पहली कैंडल बड़ी और मंदी (बियरिश) होती है, जबकि दूसरी कैंडल छोटी और तेजी (बुलिश) होती है, जो पूरी तरह पहली कैंडल के अंदर होती है। यह पैटर्न दर्शाता है कि बिकवाली का दबाव कम हो रहा है और खरीदारी की संभावना बढ़ रही है।
मुख्य विशेषताएँ:
- डाउनट्रेंड के निचले हिस्से में बनता है।
- पहली कैंडल बड़ी और बियरिश होती है।
- दूसरी कैंडल छोटी और बुलिश होती है, जो पहली कैंडल के दायरे में रहती है।
- यदि अगली कैंडल बुलिश होती है, तो ट्रेंड रिवर्सल का संकेत मिलता है।
ट्रेडिंग रणनीति:
- पुष्टि के लिए अगली बुलिश कैंडल का इंतजार करें।
- वॉल्यूम विश्लेषण का उपयोग करें ताकि संकेत मजबूत हो।
- अधिक सटीकता के लिए RSI या MACD जैसे संकेतकों के साथ उपयोग करें।
🚀 यह पैटर्न ट्रेडर्स के लिए एक उपयोगी संकेत हो सकता है, लेकिन अन्य तकनीकी विश्लेषण टूल के साथ इसका समर्थन करना जरूरी है।