Three Inside Up Candlestick Pattern
The Three Inside Up is a bullish reversal pattern that appears after a downtrend, signaling a potential shift from bearish to bullish sentiment. It consists of three candles:
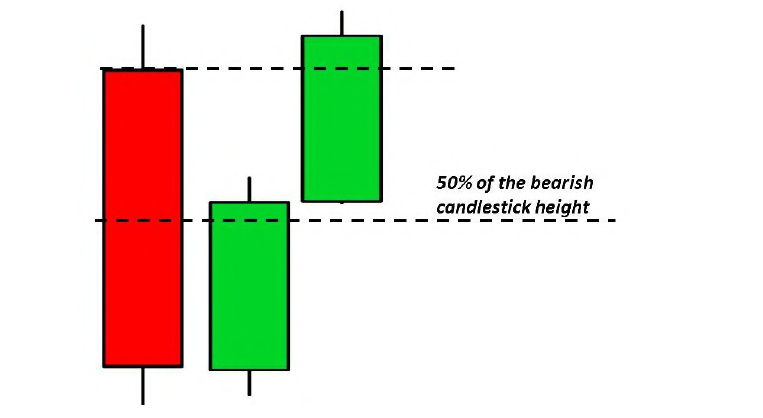
- First Candle – A large bearish (red/black) candle, indicating the continuation of the downtrend.
- Second Candle – A smaller bullish (green/white) candle that forms inside the first candle, showing weakening bearish momentum.
- Third Candle – Another bullish candle that closes above the second candle, confirming the reversal.
This pattern suggests that sellers are losing control, and buyers may take over, leading to an uptrend.
Key Features:
- Found at the bottom of a downtrend.
- The second candle forms inside the first bearish candle, indicating indecision.
- The third candle closes higher, confirming bullish momentum.
- Indicates a strong shift in market sentiment toward bullishness.
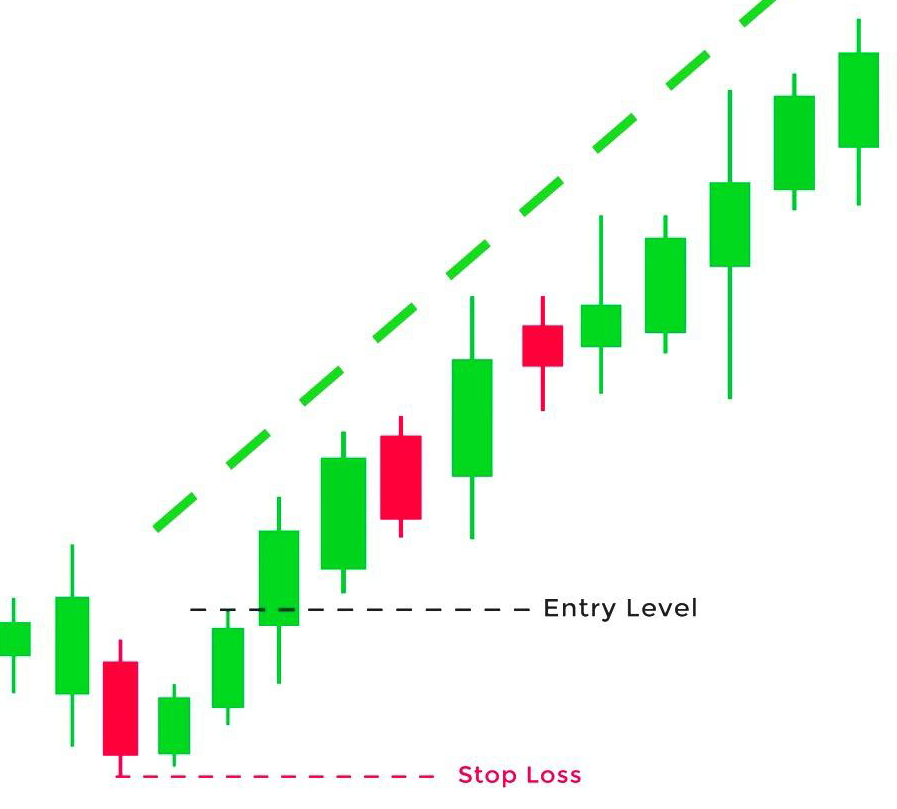
Trading Strategy:
- Enter a trade after confirming the pattern with continued bullish movement.
- Check volume to ensure strong buying pressure.
- Use RSI, MACD, or moving averages for additional confirmation.
थ्री इंसाइड अप कैंडलस्टिक पैटर्न
थ्री इंसाइड अप एक तेजी (बुलिश) रिवर्सल पैटर्न है, जो डाउनट्रेंड के बाद बनता है और संभावित अपट्रेंड का संकेत देता है। इसमें तीन कैंडल्स होती हैं:
- पहली कैंडल – एक बड़ी बियरिश (लाल/काली) कैंडल, जो डाउनट्रेंड की निरंतरता को दर्शाती है।
- दूसरी कैंडल – एक छोटी बुलिश (हरी/सफेद) कैंडल, जो पहली कैंडल के अंदर बनती है, दर्शाती है कि मंदी की गति कमजोर हो रही है।
- तीसरी कैंडल – एक और बुलिश कैंडल, जो दूसरी कैंडल के ऊपर बंद होती है, जिससे रिवर्सल की पुष्टि होती है।
यह पैटर्न दर्शाता है कि विक्रेता कमजोर हो रहे हैं, और खरीदार बाज़ार में नियंत्रण हासिल कर सकते हैं, जिससे अपट्रेंड शुरू हो सकता है।
मुख्य विशेषताएँ:
- डाउनट्रेंड के निचले हिस्से में बनता है।
- दूसरी कैंडल पहली बियरिश कैंडल के अंदर बनती है, जो अनिर्णय दर्शाती है।
- तीसरी कैंडल ऊपर बंद होती है, जो बुलिश ट्रेंड की पुष्टि करती है।
- बाज़ार में तेजी की भावना को दर्शाता है।
ट्रेडिंग रणनीति:
- इस पैटर्न की पुष्टि के लिए आगे की बुलिश मूवमेंट का इंतजार करें।
- खरीदारी के दबाव की पुष्टि के लिए वॉल्यूम की जाँच करें।
- अतिरिक्त पुष्टि के लिए RSI, MACD या मूविंग एवरेज का उपयोग करें।
📈 यह पैटर्न ट्रेडर्स के लिए एक महत्वपूर्ण संकेत हो सकता है, लेकिन इसे अन्य तकनीकी विश्लेषण टूल्स के साथ मिलाकर देखना जरूरी है।